

A brief introduction to forecasting with emphasis on demand forecasting
IMPORTANCE, ITS RELATIONSHIP TO INVENTORIES, METHODS, DEMAND COMPONENTS AND PRODUCT LIFE CYCLE
Forecasting enables informed decision making, which improves resource management and interdepartmental coordination. The field of forecasting is so broad that it is possible to apply everything from simple techniques to advanced mathematical models, or even a combination of both.
WHAT IS FORECASTING
Forecasting involves the use of quantitative and qualitative techniques to analyze historical data, identify patterns, and make estimates about the future. Unlike a guess, which is an unsubstantiated assumption, a forecast is based on mathematical methods or expert knowledge.
A forecast is a prediction of a future event. In business, forecasts help in making decisions. Its application includes forecasting demand to determine how much to produce, predicting sales in monetary units for budgeting purposes, estimating customers who will visit a bank for staff scheduling, etc.
Another important aspect is the forecasting performance, which depends on the quality and quantity of the available data, as well as on the adequacy of the model with respect to the behavior to be predicted. For this reason, it is very important to choose forecasting models that fit the nature of the problem and their continuous improvement.
Forecasts can be short-, medium- or long-term, depending on the planning horizon. Thus, forecasts are useful for day-to-day operational management; for establishing the annual sales and operations plan; and for planning the expansion of production capacity in the coming years. The classification of the planning horizon depends on the analyst and the circumstances.
IMPORTANCE OF FORECASTING
Forecasting helps to decide how many units of each product to manufacture in each period, avoiding both overstocking and understocking. It has a significant impact on inventory management and eliminating waste associated with mismanagement.
Both the manufacturing and service sectors adjust their labor levels based on expected demand in upcoming operating periods. Human resources and production departments schedule hiring to ensure availability when needed. Good forecasting helps coordinate business functions—purchasing, production, distribution, etc.
Forecasting also provides valuable information for budgeting. Income and expense projections facilitate cash management, investment planning, efficient resource allocation, etc.
Product portfolio management also benefits from good forecasting. If sales increase, it may be necessary to expand production capacity. If sales decline, consider whether it is time to remove the product from the portfolio. When products are withdrawn from the market, consider what products can be introduced to replace those that have been withdrawn or, alternatively, whether it is possible to relaunch products for which demand has declined.
DEMAND FORECASTING AND ITS RELATIONSHIP TO INVENTORIES
Forecasting helps manage inventory levels, reducing storage costs and the risks of overproduction or shortages. Customer satisfaction levels are positively impacted by ensuring that products are available when needed. As a result, profitability will improve.
Conversely, poor forecasting is associated with poor inventory management, higher warehousing costs, product obsolescence, lost sales and reduced customer satisfaction. In some cases, poor forecasting will damage the company's reputation, thereby reducing its competitiveness in the marketplace.
It is desirable to balance supply and demand, i.e. to produce enough units to satisfy demand without generating excess stock. From a production planning perspective, the objective of forecasting is to avoid overproduction and the associated storage costs, while ensuring product availability, thus avoiding lost sales and customer dissatisfaction.
The decision of how much to produce has an impact on several functions of a company. For example:
Personnel are hired or reduced based on production needs, which avoids work overloads or downtime.
Purchases of raw materials and supplies are directly related to the quantity to be produced, which avoids surpluses or shortages.
Knowing the quantity to be produced helps to determine the resources needed for its distribution.
Inventory ties up capital that could be used in other areas of the business. Large amounts of inventory translate into large amounts of money that cannot be used until the product is sold. The tied-up capital could be used to improve processes, drive innovation or invest in other projects.
Excess inventory hides problems in the production process. Too many products in inventory hide inefficiencies, quality problems or failures in demand planning. In general, reducing inventory reveals problems and, as a result, you can work to solve them.
In addition, excess inventory generates additional storage costs: physical space, management systems, security, spoilage, obsolescence, etc. It also limits the flexibility to respond to changes in demand. A large inventory of finished products makes it difficult to quickly adjust production to new customer preferences.
WHAT MAKES A GOOD FORECAST
Forecasts must balance accuracy, timeliness and cost. In this way, decisions will be informed, timely and economically viable. It has been pointed out in the previous paragraphs that accurate forecasts reduce costs due to overproduction or shortages. In addition, forecasts must be available on time, as late forecasts are useless. The balance between accuracy and cost must also be taken into account; each improvement in accuracy must translate into a monetary benefit that exceeds the costs of refining the forecasting model.
Forecasts never give an exact answer, the reason being that they are based on historical data and assumptions about the future, which generates uncertainty. For example, the demand for any product is always subject to changes in the market, technological innovations, economic crises, etc.
However, a good forecast gives an idea of how many units will be sold, so it is much better than nothing. If the forecast is that 900 units will be sold next week, chances are that very close to 900 units will be sold. In this way, production and inventory levels can be planned.
The more distant the forecast, the less accurate it will be. The greater the time elapsed between the present and the future occurrence of the event to be forecast, the greater the uncertainty.
It is important to know that no one forecasting method is better than another. The choice of the most appropriate method depends on the behavior of the data, the availability of historical data, the planning time horizon and the specific objective of the forecast. Analysts should test several methods and evaluate their accuracy, in addition to the factors already mentioned.
FORECASTING METHODS
Demand forecasting methods fall into three main categories: qualitative, causal and time series. Each of these methods is suited to different situations and types of data.
QUALITATIVE METHODS
Qualitative methods are based on expert judgment and opinion. They are useful when historical data are not available (launch of a new product) or when dealing with singular events (radical changes in the market). The most common qualitative methods are the Delphi method and market research.
CAUSAL METHODS
Causal methods attempt to establish cause-effect relationships between variables. In this case, the models describe how one or several independent variables (x1, x2, x3,…,xn) affect the behavior of the dependent variable (y), which is to be predicted. In other words, how do changes in an independent variable influence the behavior of the dependent variable?
For example, multiple linear regression can be used to express the relationship between the demand for a product (dependent variable) and variables such as price, advertising and the income level of buyers (independent variables). These methods are used when historical data are available.
Another example is the sale of bottled water, which is assumed to be related to temperature, humidity, season of the year, day of the week, time of day, etc.
TIME SERIES
Time series methods project historical data into the future ignoring any other variables. It is assumed that demand behavior will be the same in the future. These methods include moving average, single exponential smoothing, double exponential smoothing and triple exponential smoothing. The time units should be consistent, so if monthly motorcycle sales are forecast, historical monthly motorcycle sales data should be used.
OBTAINING DATA FOR FORECASTING
There are several sources, internal and external, to obtain data for forecasting. For example, internal sources include sales history. Past production order records provide information on production capacity.
For several years now, enterprise resource planning (ERP) systems have seamlessly integrated and recorded information from various areas within companies. This allows stakeholders to easily access and analyze historical data on production, inventory, and sales.
External sources include databases managed by governments or non-governmental associations. These include market studies that reveal trends in consumer behavior. Industry sector studies that assess competition. Economic indicators that influence demand: gross domestic product (GDP), inflation, employment rate, etc.
Today, social networks provide information in the form of opinions, making it easy to identify emerging trends by analyzing hashtags, mentions and conversations. It is possible to deduce whether the perception of a product or brand is positive or negative and predict its impact on demand. Social media is a means for companies to receive real-time feedback, allowing them to identify opportunities for improvement. In addition, the activity of competitors and the reception of products by consumers are tracked.
Historical demand, which refers to the number of units sold of a product over time, is used to forecast sales. It can be expressed on different time scales, e.g. weekly demand, monthly demand, quarterly demand, etc. The data to construct a time series of demand is found in sales records.
This information is used to identify patterns of behavior, such as high demand during certain seasons or specific events, which helps to adjust inventory levels and production.
Data quality is very important for forecast accuracy. The quality of the output data of a forecast depends on the quality of the input data. It is often said that “garbage in, garbage out”. If the data fed into the forecasting model is inaccurate, incomplete, outdated or irrelevant, the resulting forecast will be unreliable. Good quality input data increases the likelihood that the forecasting model will perform satisfactorily. If the necessary information does not exist or is not available, it must be collected, which can be very costly.
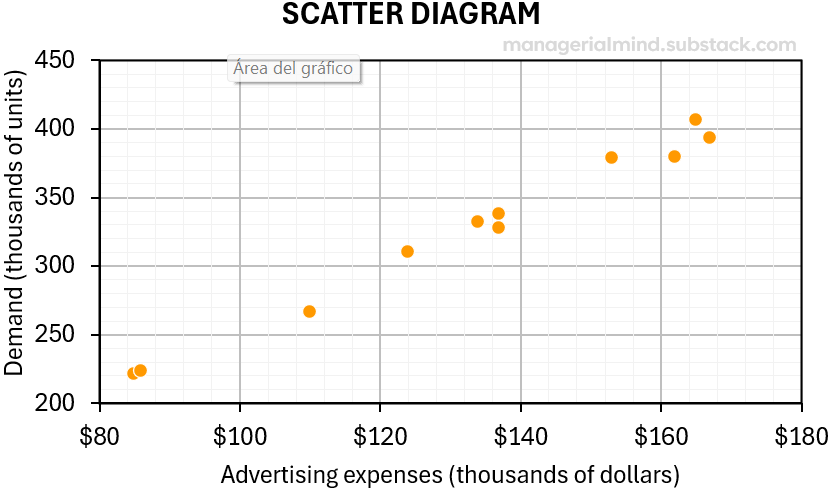
SCATTER DIAGRAM
A scatter diagram is a graphical tool used to identify and analyze the relationship between variables. For its elaboration, points are plotted on a Cartesian plane, where each point represents a pair of values corresponding to the two variables whose relationship is being studied.
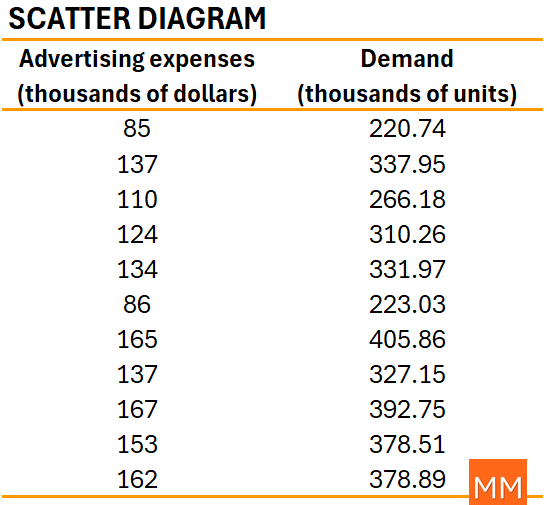
In regression analysis, the scatter diagram is a tool for visualizing the relationship between the dependent and independent variables. The scale of values of the independent variable is represented on the horizontal axis and the scale of values of the dependent variable on the vertical axis.
It is important to mention that there is no absolute linear relationship between the variables. If a straight line is drawn to fit the data set, some of the points will be on the line, some will be close, and some will be farther away. The distance between a point and the line is the error that occurs when using a linear model to predict the demand associated with advertising spending.
DEMAND COMPONENTS
If historical data are available, a scatter diagram should be drawn to establish a hypothesis on the behavior of demand, its components are then identified and a forecasting model is selected. The components of demand are trend, seasonality, cyclicality and random variations.
TREND
The time series can be increasing, decreasing or stable. An increasing trend indicates an increase in demand over time, while a decreasing trend means that demand is decreasing. If the demand is stable, it is neither increasing nor decreasing. The trend may be linear or non-linear.
Stationary processes are characterized by maintaining a stable level over time. The mean of the data does not change, so they are called stable or stationary time series. This behavior is very predictable.
Some products that regularly exhibit this behavior are bar soap, toilet paper, table salt, garbage bags, shampoo, dishwashing sponges, toothpaste, among others.
Demand growth occurs when the quantity sold of a product increases over time. This behavior is driven by factors such as market growth, product innovations, changes in consumer preferences, marketing strategies, etc. In this case, demand is on an upward trend.
One example is smartphones, due to continuous innovation and the growing dependence on mobile technology. Progressive concern for wellness has driven the sale of wristbands or watches that measure the number of steps a person takes per day. Sustainability has driven the sale of electric cars, solar panels and environmentally friendly personal hygiene products. Parents are concerned about their children's early education, which has promoted the sale of educational toys. The popularization of telecommuting has led to increased sales of project management software.
Declining demand occurs when sales of a product decrease over time. The decrease in the quantity sold is associated with factors such as technological obsolescence, changes in consumer preferences, the emergence of substitute products, market saturation, etc.
When companies detect a downward trend, they quickly decide to diversify by innovating or reorienting themselves towards new markets.
The need for landline telephones has decreased due to the popularization of cell phones. Analog cameras have been displaced by digital cameras and smartphones. Sales of DVD players have declined following the emergence of streaming platforms. Digital media have reduced the demand for printed newspapers, something similar has happened with encyclopedias. Smartphones have replaced wristwatches and alarm clocks. Today it is almost impossible to find a typewriter, most people use desktop personal computers, whose sales have also declined, many people prefer laptops or tablets. Storage drives evolved from floppy disks to CDs, then to USBs and finally to cloud storage services.
SEASONALITY
Seasonality is associated with high and low sales seasons that are recurring and repeat at regular intervals, such as weeks, months, quarters, etc. Some of the causes of seasonality are weather, holidays, vacations, etc. Anticipating seasonality makes it easier to coordinate business activities in both high and low seasons.
Seasonality reflects variations above or below the trend line over time. For example, sales of swimsuits and sunscreen increase in the summer. Sales of toys and Christmas decorations increase at the end of the year. Movie ticket sales increase on weekends. Flower sales increase on Valentine's Day. During the coldest months of the year, sales of coats, gloves and scarves increase.
In addition, amusement parks receive more visitors on weekends and holiday periods. Banks, restaurants and cafes experience peak hours. Seasonality can be accompanied by a trend.
CYCLICALITY
Cyclicality is related to the economic cycles of the economy or of a particular industry sector, and therefore occurs at irregular intervals, making it difficult to predict.
For example, automobile sales decline during recessions. Homes sell in greater numbers when interest rates are low and the economy is growing. More refrigerators, washing machines and luxury cars are sold when the economy is expanding. Increased demand for construction machinery is associated with periods of economic expansion, which are related to infrastructure projects.
RANDOM VARIATIONS
Random variations, also known as random fluctuations or noise, are changes in demand that do not follow a pattern and are therefore unpredictable. They are the result of chance. Its effects on demand behaviour occur in the short term. Its mean must be equal to zero and its variance constant.
EXTREME EVENTS
Extreme events are extraordinary, high-impact situations that temporarily alter the demand for certain products. These events can originate from natural phenomena (such as hurricanes or pandemics) or result from human actions (including political, social, or economic issues).
For instance, following natural disasters like earthquakes, hurricanes, and storms, there is a heightened demand for canned food, first aid kits, building materials, and electric generators. During outbreaks of contagious diseases, sales of specific medications, masks, gloves, and disinfectants surge. An unusual wave of extreme cold drives up the sales of coats, gloves, and thermal clothing. Similarly, a heat wave boosts the sales of bottled water.
PRODUCT LIFE CYCLE
The product life cycle encompasses the journey of a product from its initial conception to its eventual withdrawal from the market. This journey is divided into five key stages: development, launch, growth, maturity, and decline. Each of these stages has a unique set of characteristics and challenges, directly impacting demand forecasting and sales predictions. Understanding how demand shifts across these stages is crucial for businesses aiming to optimize their strategies and maximize product longevity.
The first stage, development, involves meticulous research and innovative product design. This crucial phase demands a substantial investment of both time and resources to evolve a mere idea into a feasible prototype. Rigorous testing and iterative modifications are conducted throughout to ensure the product meets both stringent quality standards and market demands. The outputs of this phase are the units required for pilot batches, serving as the blueprint for potential large-scale production.
The second phase, launch, involves introducing the product to the market. Initial production is typically kept small, with efforts focused on positioning the product and creating demand. During this stage, production must remain adaptable to shifts in demand. Sales are generally low but gradually increasing.
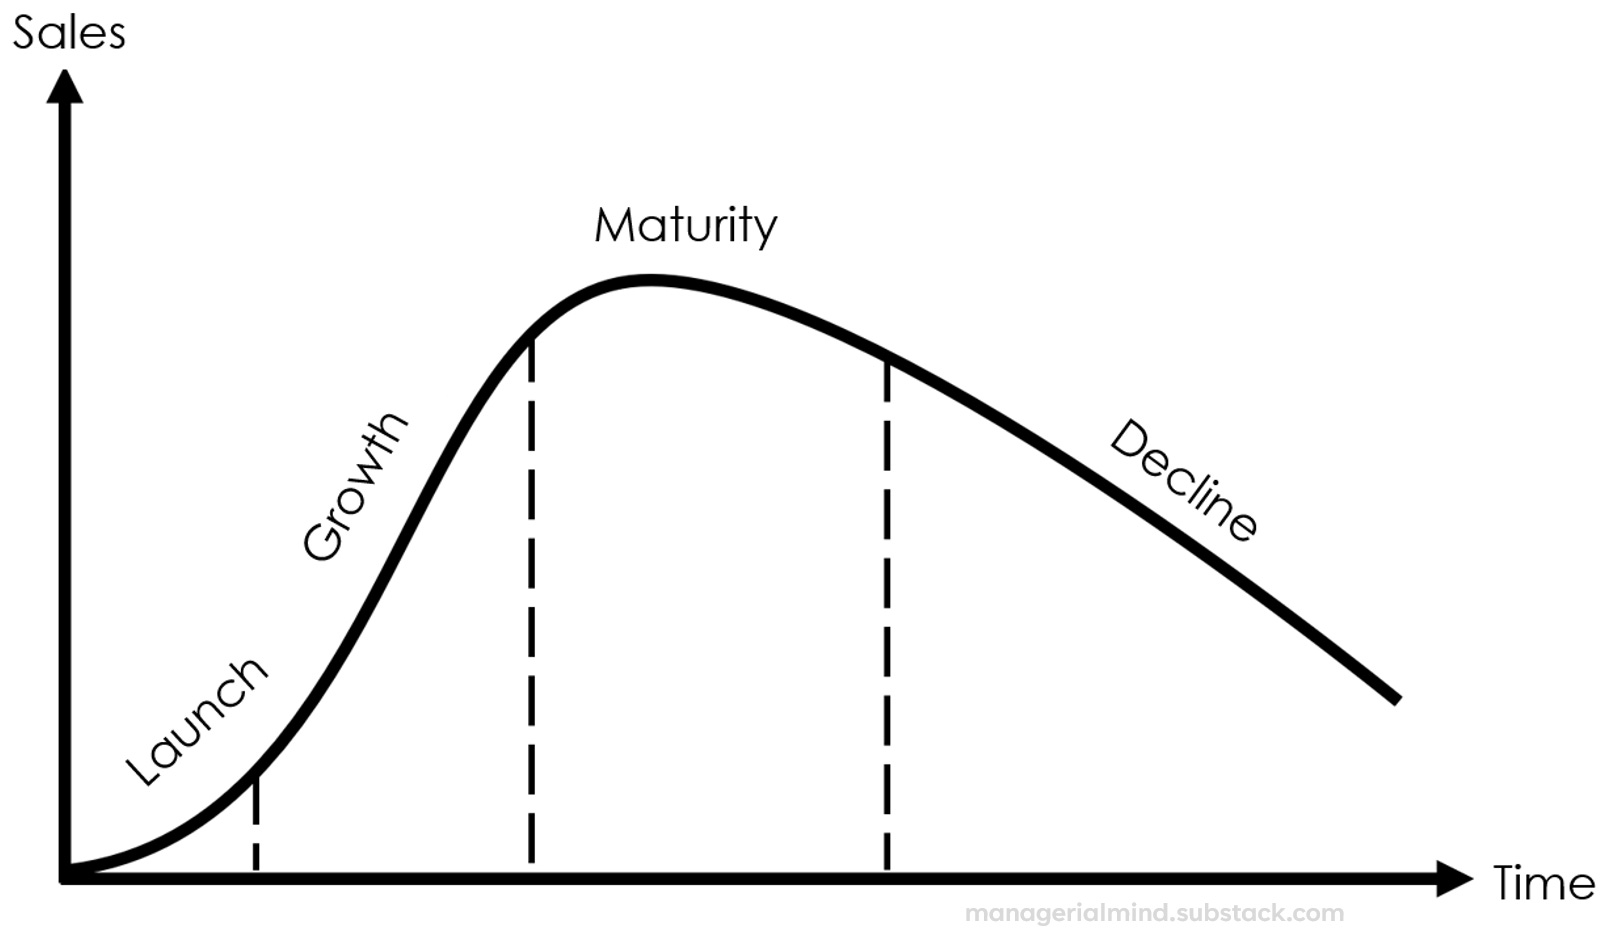
The third stage, growth, unfolds when the product gains market acceptance and demand escalates steadily. To meet this surging demand, production capacity must be scaled rapidly. This phase necessitates expanding facilities, acquiring additional machinery, enhancing production processes, and ensuring a seamless flow of materials and components.
The fourth stage, maturity, marks a period of demand stabilization. During this phase, sales have reached their zenith, growth is decelerating, and the market has become saturated. Competition among producers intensifies, making product differentiation essential for a successful competitive strategy.
The fifth and final stage, known as decline, is marked by a steady drop in demand for the product, often due to evolving consumer preferences or the emergence of new competitors. During this phase, production is gradually scaled back, and the product faces either market withdrawal or a strategic relaunch.
The duration of a product's life cycle varies significantly based on the type of product. Technological products typically experience shorter life cycles, driven by rapid innovation and the relentless march of obsolescence, compelling companies to release new models frequently. Conversely, essential goods like food and clothing enjoy longer life cycles due to consistent demand and a more gradual rate of change.